
2026 Edition
The US 250 Report

Executive Summary
In this report, we rank and analyze the largest and most active private equity (PE) investors in the US.
We take a novel approach to our ranking, which is based on the total estimated managed enterprise value (EV) of investors’ portfolio companies headquartered in the US. This approach enables us to go deeper and uncover differentiated insights unavailable elsewhere.
Further, this approach helps us capture large investors who do not rely on traditional fundraising and are often overlooked by other industry rankings.
Key takeaways from our analysis:
Blackstone has emerged as the largest private equity investor in the US, managing a total estimated EV of $245bn, followed by KKR ($170bn) and Apollo ($146bn). Other investors in the top 10 include Thoma Bravo ($101bn), Bain Capital ($86bn), EQT ($83bn), Vista Equity Partners ($82bn), TPG Capital ($81bn), Carlyle ($73bn) and Brookfield Asset Management ($69bn).
Collectively, the top 250 investors in the US manage an EV of $4.3tn across 7,280 assets. Despite its significant size, the aggregated US 250 EV is just 5% of the US public equity market ($81tn).
US-headquartered sponsors dominate the ranking. They manage 86% of the total aggregate US 250 EV. The US 250 landscape is fairly concentrated at the upper end, with the top 25 investors managing 45% of aggregate EV. All of the top 10 firms were founded during or before the 2000s.
Leading the sector 50 rankings are Thoma Bravo (TMT, $96bn), Blackstone (Services $40bn, Energy & Materials $29bn and Financial Services $34bn), Apollo (Science & Health, $17bn and Industrials, $28bn) and Roark Capital (Consumer, $39bn). International sponsors' presence is most notable in Energy & Materials (28%) and Infrastructure (17%).
TMT is the largest PE sector in the US (28% of EV), followed by Services (20%). Geographically, assets are concentrated in California (14%), Texas (12%), Illinois (7%), New York (7%), Florida (6%) and Massachusetts (5%).
If you have any questions about the data or the report, do not hesitate to reach out to insights@gain.ai.




Chapter 01: US 250 Investor Ranking
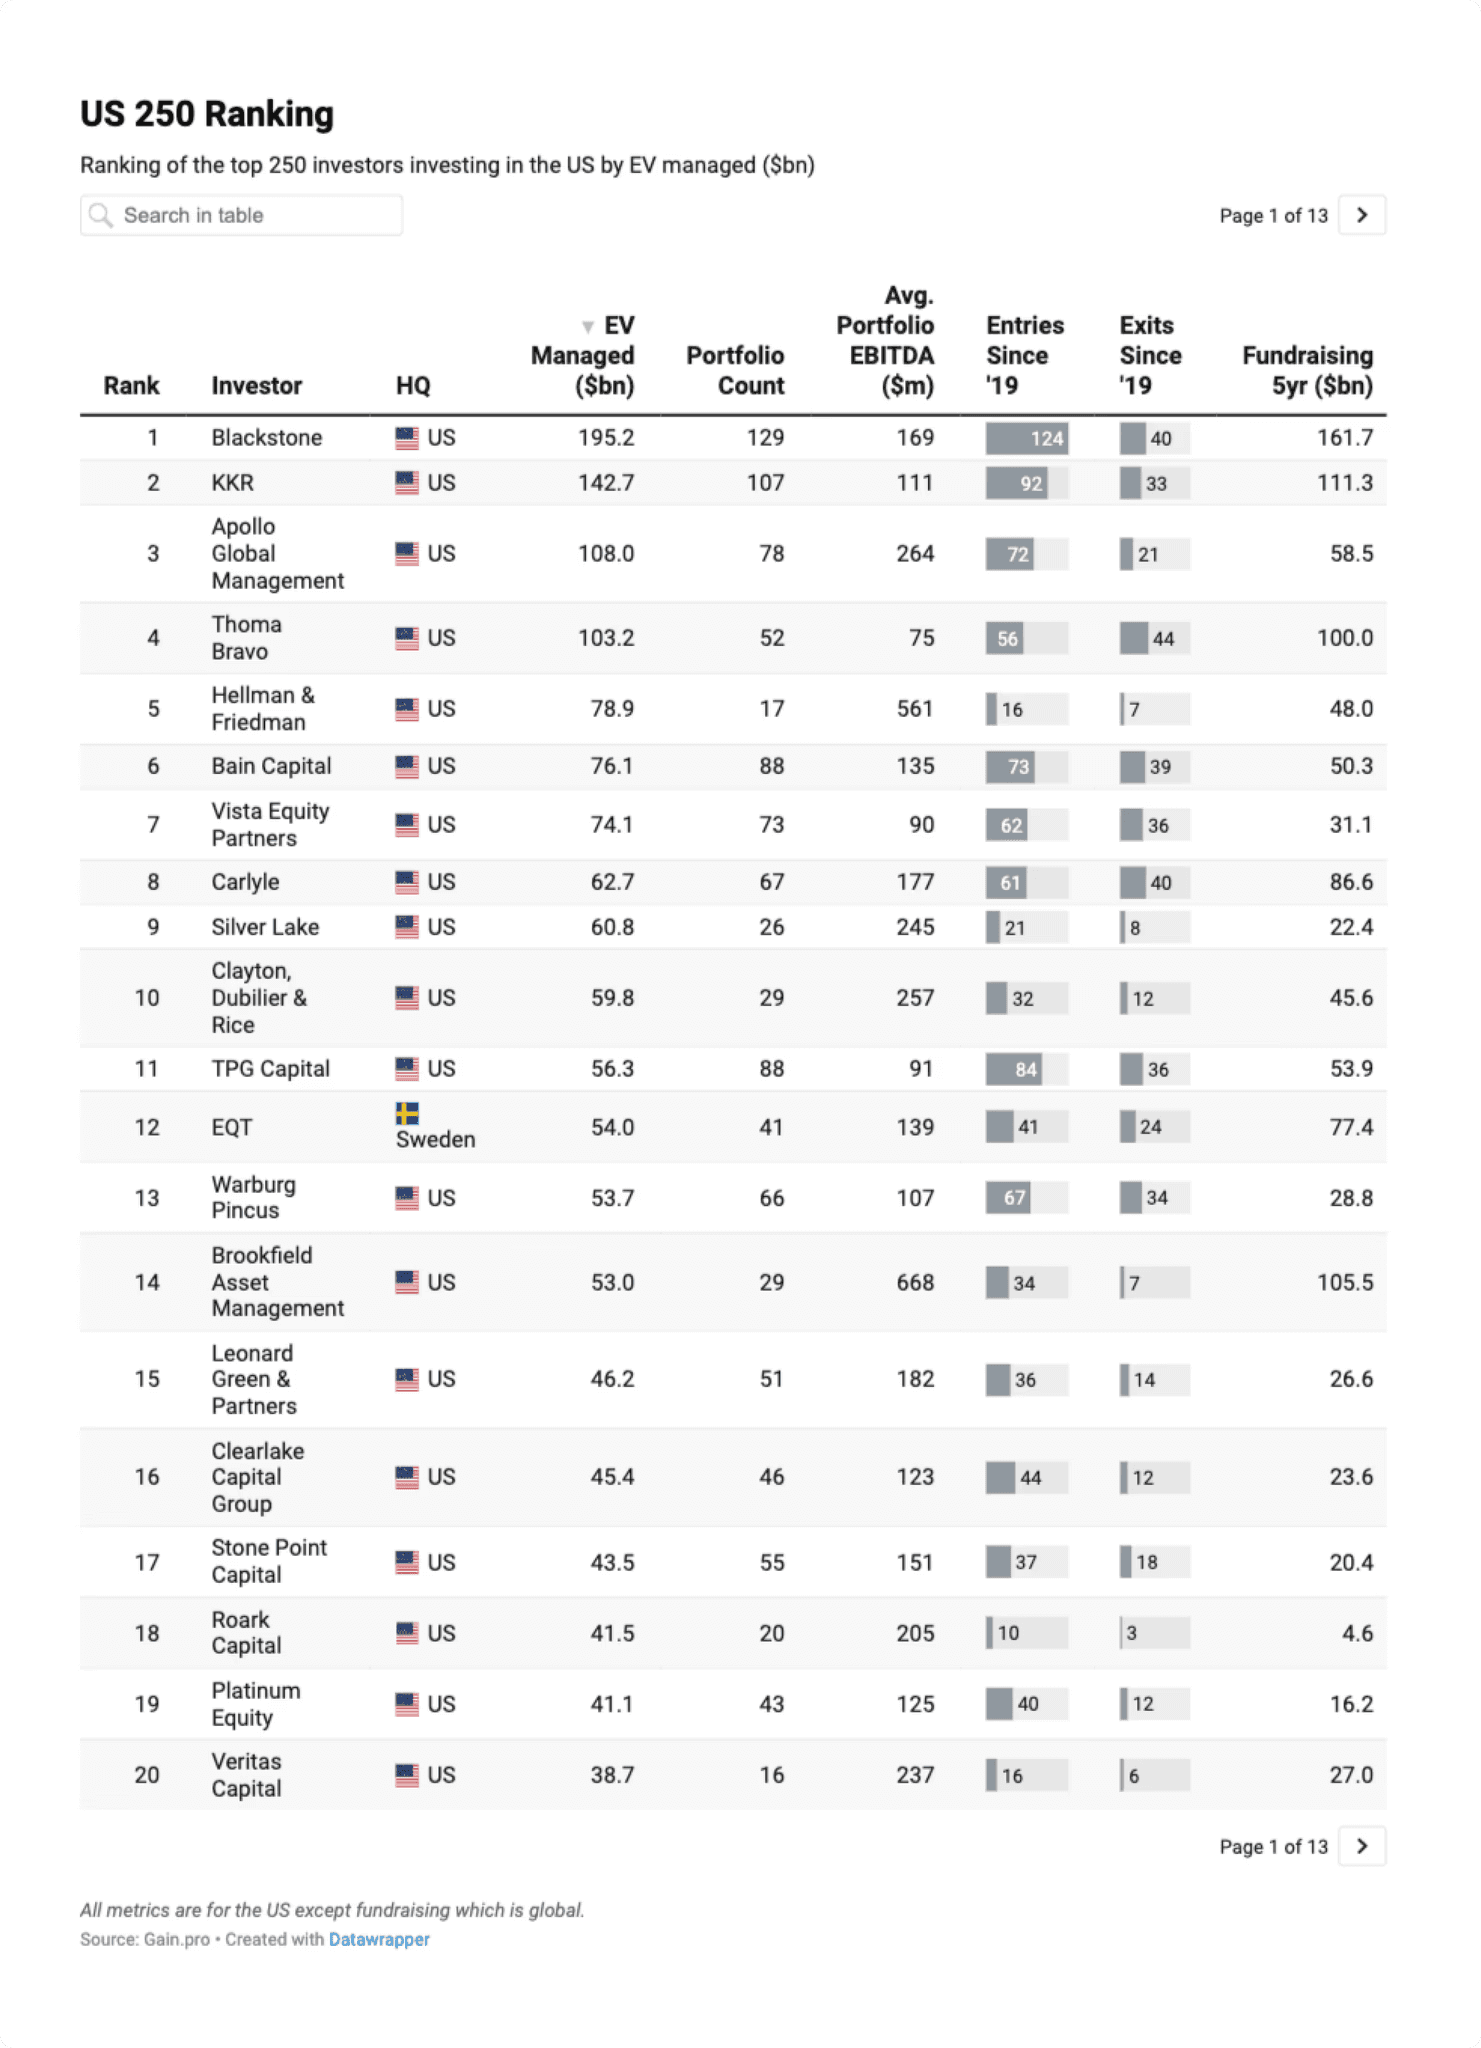
Blackstone has emerged as the largest private equity investor in the US, managing a total estimated EV of $245bn, followed by KKR ($170bn) and Apollo ($146bn).
Other investors in the top 10 include Thoma Bravo ($101bn), Bain Capital ($86bn), EQT ($83bn), Vista Equity Partners ($82bn), TPG Capital ($81bn), Carlyle ($73bn), and Brookfield Asset Management ($69bn).
Collectively, the top 250 investors in the US manage an EV of $4.3tn across 7,280 assets. On average, they have a portfolio EBITDA of $43m and manage 29 companies each.
Over the last 7 years, US 250 investors have invested in 2.5x as many new portfolio companies as they have exited. Specifically, there have been 6,209 new investments and 2,498 exits from these sponsors.
The table below lists all the top 250 investors in the US. Use the search bar or the arrows at the top to navigate through the ranking.
Dominant Investor HQs
North American HQ'd sponsors dominate the US 250 ranking. They account for 42 of the top 50 investors. Only a few international investors rank among the largest players, including EQT ($82.9bn), GIC ($54.4bn), ADIA ($42.1bn) and Partners Group ($41.9bn).

US-headquartered sponsors dominate the ranking. They manage 86% of the total aggregate US 250 EV. The role of international sponsors remains limited and is skewed towards the large-cap market. They hold 15% of assets above $1bn EV, dropping to just 7% for assets below $50m EV. After the US, Canada HQ’d investors have the largest share of US 250 EV at $160bn (4%), followed by the UK&I at $147bn (3%).

New York is the largest hub for investors in our ranking, accounting for 35% of investor HQs, followed by Boston (7%), Chicago (7%), and San Francisco (5%). Other notable hubs include Los Angeles (3%), Greenwich (3%), Menlo Park (3%), Stamford (2%), Dallas (2%), and Washington, D.C. (2%). Outside the US, London (4%) and Toronto (2%) stand out as the major hubs.

Chapter 02: Sector 50 Rankings
This table showcases the top 50 private equity firms ranked by sector in the US. Use the buttons to navigate between the different sector rankings.
Top Investors
Leading the sector 50 rankings are Blackstone (Services, Energy & Materials, and Financials), Apollo (Science & Health and Industrials), Thoma Bravo (TMT), and Roark Capital (Consumer). From the leaderboard, Thoma Bravo and Roark Capital stand out for being highly focused on one sector, with 94% and 82% of their portfolio EV concentrated in TMT and Consumer, respectively.

Sector Insights
By sector, TMT is by far the largest PE sector in the US (28% of EV), followed by Services (20%). At the subsector level, Software (19%) is the largest, followed by Professional Services (10%), Manufacturing (8%), and Healthcare Services (6%).

Sponsor-to-sponsor transactions remain the most common entry route across most sectors. Carve-outs are notably more prevalent in Industrials (26%) and Energy & Materials (25%), driven by large-scale conglomerates divesting assets to realign strategic focus. Public-to-private activity is highest in Infrastructure (34%) and TMT (33%). Family-to-sponsor transactions are relatively more common in Consumer (32%).

Chapter 03: Region 50 Rankings
This table showcases the top 50 private equity firms ranked by region across the US. Use the buttons to navigate between the different regional rankings.
Top Investors
Leading the region 50 rankings are Blackstone (South, $108bn and Midwest, $41bn), KKR (West, $66bn), and Bain Capital (Northeast, $33bn). Blackstone places in the top three for all of the four regions, while Apollo and KKR appear in three out of four.

Regional Insights
The South holds the largest share of US 250 EV (36%), driven by large concentrations in Texas (12%), Florida (6%), and Georgia (4%). California, which contributes 14% of EV, the most of any state, drives the West's share. New York (7%) leads the Northeast, while Illinois (7%) is the largest state in the Midwest. Overall, the US 250 is highly concentrated, with the top four states accounting for 40% of total EV.

By HQ city, New York (5%), Houston (3%), and Chicago (2%) are the largest hubs for US 250 portfolio companies, followed by Atlanta (2%), Dallas (2%), Austin (2%), Los Angeles (1%), Denver (1%), and San Francisco (1%). Other notable hubs include Boston, Charlotte, and Miami.

Chapter 04: Portfolio Insights
In this section, we explore the investment portfolios of the top 30 PE investors in the ranking, analyzing key metrics such as EBITDA range, growth rates, buy-and-build activity, holding periods, and the sector/regional makeup of their US investments.
Note: We exclude from this analysis investors who have fewer than 5 data points for a particular metric.
Over the last 7-year period, Blackstone (150), KKR (119), and TPG (118) led US PE entry activity. Entry activity peaked in 2021 followed by softening in 2022-23 amid challenging market conditions. Activity has rebounded since then in 2024-25, but remains low for 2026 so far.

Sponsor-to-sponsor is the most common entry route across most investors. TMT specialists such as Thoma Bravo (70%) and Vista Equity (57%) stand out as large take-private investors. Veritas Capital has the highest share of carve-outs at 54% of EV, followed by Silver Lake (39%).

By exit count, H.I.G Capital (50) and Blackstone (49) are among the most active. Broadly, exits peaked in 2021 before declining in 2022-2023 as market conditions deteriorated, but activity has recovered in 2024-2025.

Methodology
The data for this report comes from Gain.
We take a novel approach to our ranking, which is based on total managed enterprise value (EV).
At Gain, we track over 27,500 investor portfolios in detail. To estimate the managed enterprise value (EV), we estimate the EV for each asset in an investor’s portfolio. We begin with the latest reported deal value, where publicly available. If it's not available, we estimate the EV by multiplying EBITDA by the predicted exit multiple.
The total EV is then aggregated at the investor level.
We scale the last reported deal value by a growth multiplier to estimate its current holding value. We also adjust EV for the investor's estimated ownership share in an asset.
Where there aren't reported deal figures or financials, we estimate them using the asset's revenue, subsector margins and revenue/FTE calculations.

We only consider majority buyout and minority-owned PE assets for our rankings. We exclude any VC investments and publicly listed stakes. To predict exit multiples, we consider an asset’s sector, size, growth rate, margin profile and cash generation.
Our ranking is limited to the US-headquartered portfolio of the investors.
Further, we include only active investors in the ranking with i) 5 or more portfolio companies in the US; ii) 5 or more entries since 2020.
For the sector and regional rankings, we include investors with i) 3 or more portfolio companies in that sector/region in the US and ii) 3 or more entries in that sector/region since 2020.
We ranked the top 40 investors in Financials and Energy & Materials and the top 10 in Infrastructure.
Unless otherwise stated, all metrics and calculations are based on an investor's portfolio in the US only. We excluded investors with <5 data points for any aggregate metrics in the portfolio insights section.
Related Research
Discover our proprietary reports on investors, assets and PE deals.